WAVE MODELING
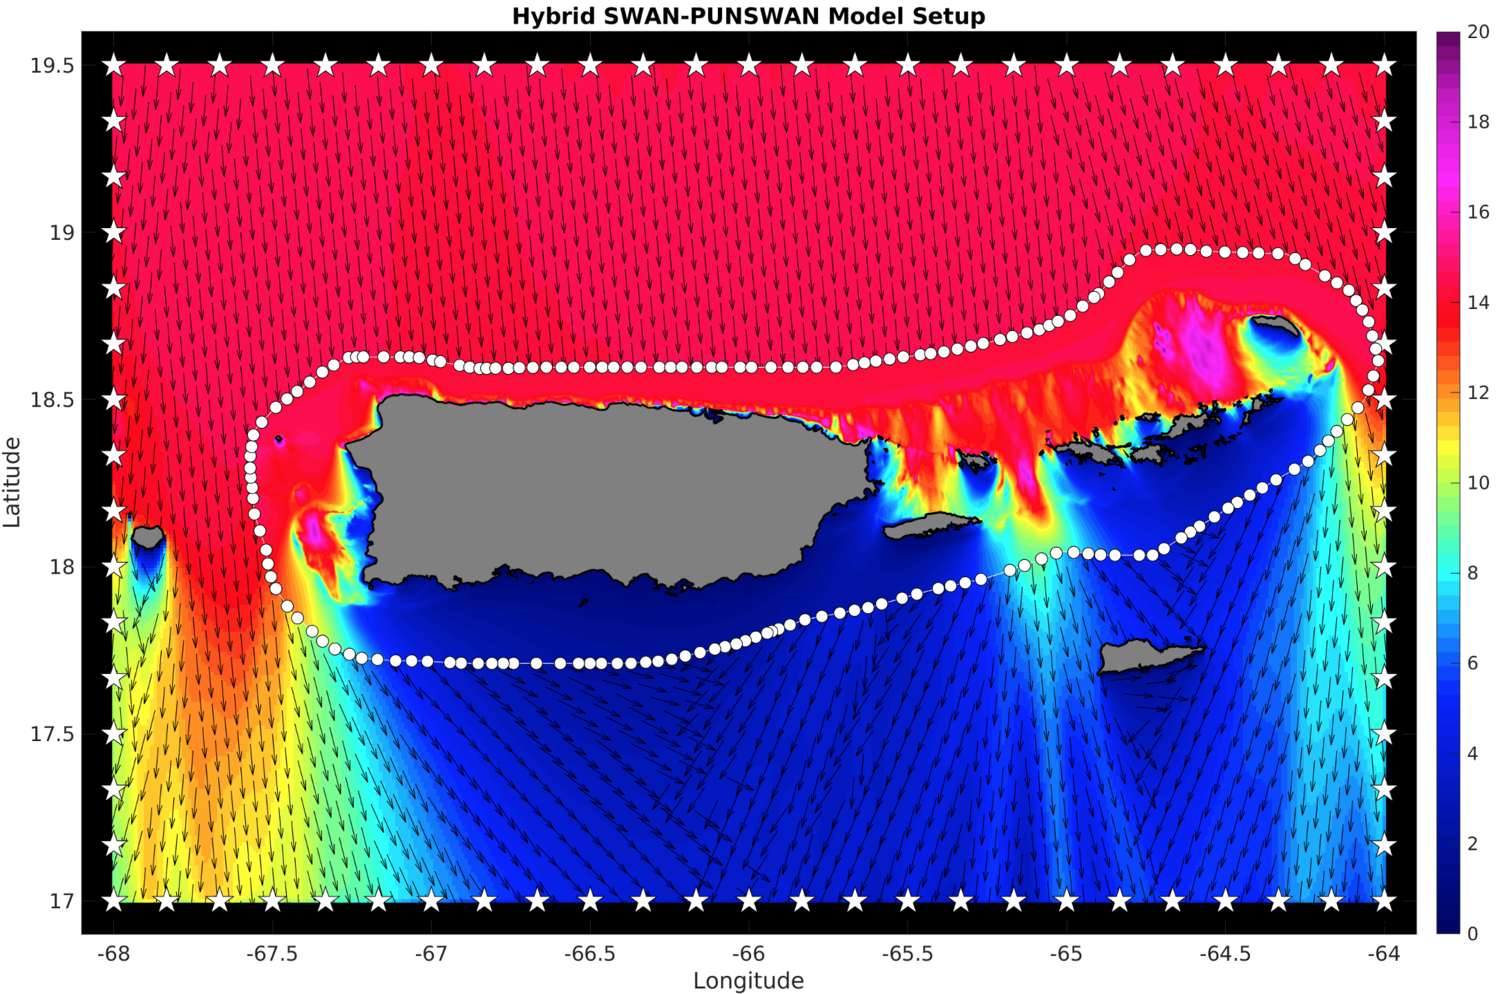
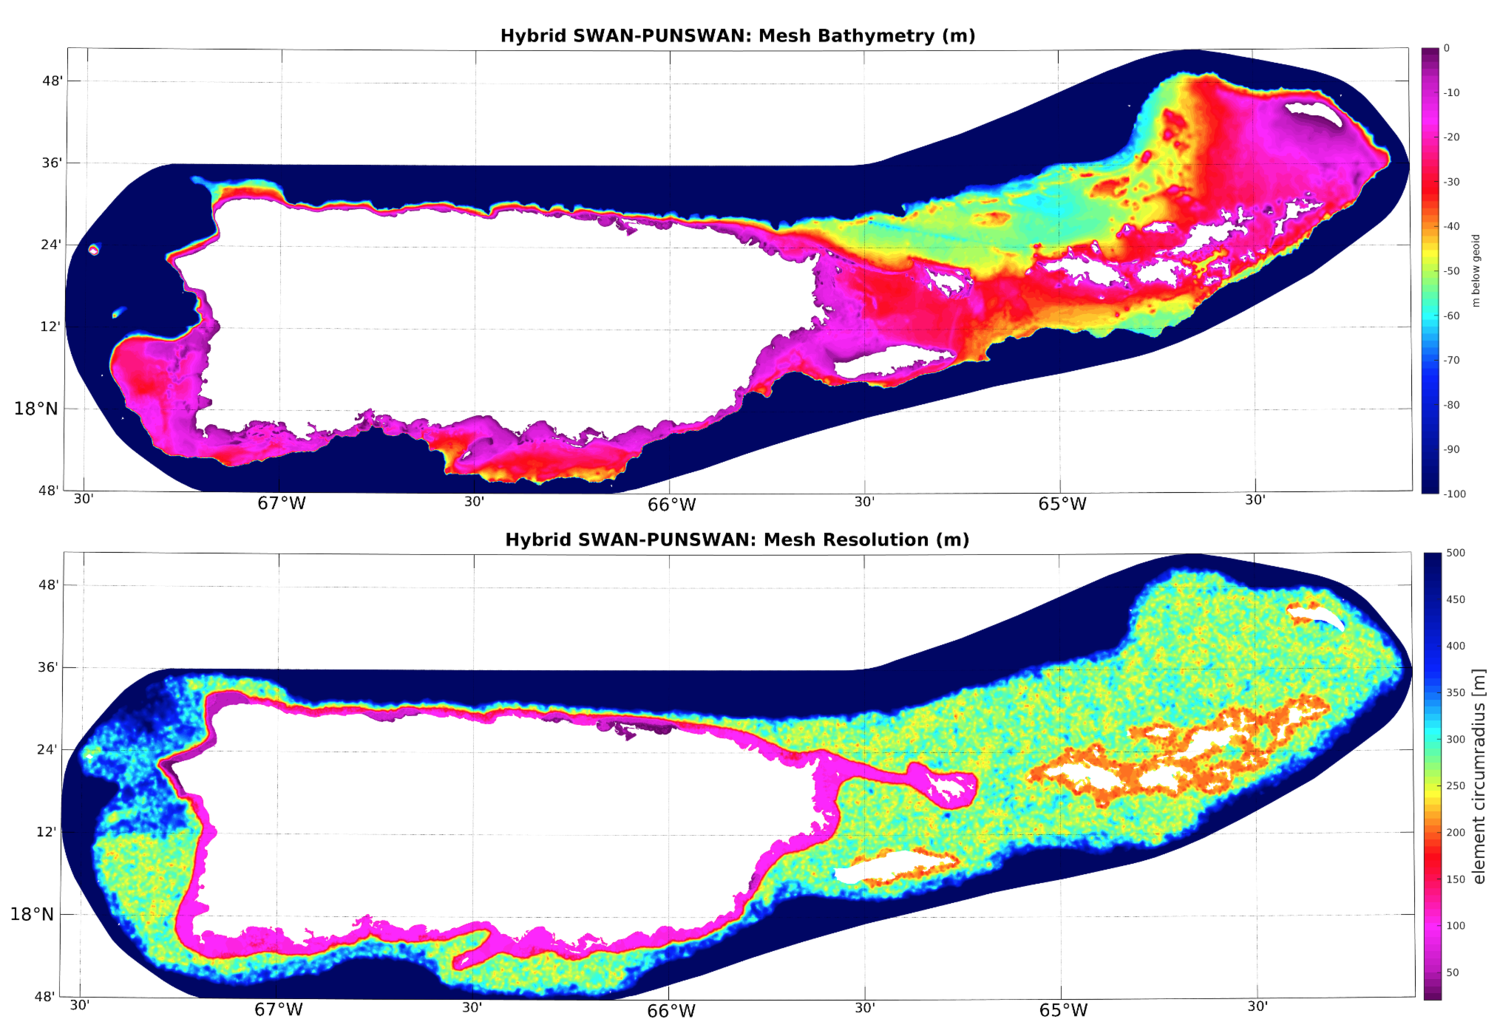
For the present study we have carried out a 40-year high-resolution wave climate simulation based on the Simulating Waves Nearshore (SWAN) spectral wave model, which is described in detail in (Booij et al., 1999) and (The SWAN Team, 2012). Details of the setup and validation of the CARICOOS Nearshore Wave Model, a similar model developed by CARICOOS Co-PI Miguel Canals, may be found in Anselmi et al. (2012), Canals et al. (2012) and Canals and García (2019). SWAN is a state of the art spectral wave model which takes into account the effects of wave shoaling, diffraction and refraction, nonlinear wave-wave interactions (triads and quadruplets), and dissipation due to wave breaking and bottom friction. A schematic of the model setup is shown in Figure 1. We use a hybrid approach combining a coarse structured SWAN grid at 1 kilometer resolution with an unstructured mesh around Puerto Rico and most of the USVI. The blue area shows the structured SWAN grid at 1-kilometer resolution. This coarse structured grid obtains boundary conditions from the regional NOAA NCEP Multigrid WaveWatch III Model (Chawla et al., 2013) in the form of 2D wave spectra at the locations shown as white stars. The yellow area shows the footprint of the unstructured SWAN mesh, which is nested within the structured SWAN model and which obtains 2D spectral boundary conditions from the structured SWAN grid at the locations indicated by white circles. The unstructured mesh was developed using the Oceanmesh 2D MATLAB package (Roberts et al., 2019). The mesh resolution varies from 500 meters in deep water to 20 meters very close to the shoreline. The mesh bathymetry is obtained from the NOAA Continuously Updated, 1/9th arc-second Digital Elevation Model that was developed using 2016 and 2018 LIDAR data and single and multibeam bathymetry data. Figure 2 shows the mesh bathymetry (top) and spatial resolution (bottom).
The SWAN model resolves wave transformation in spectral space by solving the spectral energy balance equation which describes the evolution of the 2D wave spectrum (frequency and direction) at each computational node. The directional resolution is 5 degrees and the frequency spectrum is divided into 36 bins with frequencies ranging from 0.04 Hz to 0.667 Hz, allowing the model to resolve waves with wave periods between 1.5 and 25 seconds. The SWAN model is run in third generation mode, which includes model physics such as quadruplet interactions, exponential wind wave growth and white-capping (The SWAN Team, 2012). Model physics also include wave energy dissipation due to bottom friction using the JONSWAP formulation, triad wave interactions, diffraction and depth-induced wave breaking (The SWAN Team, 2012).
Spectral boundary conditions
To capture far field wave conditions, spectral boundary conditions in the form of two-dimensional wave spectra are applied at the structured SWAN model boundaries using output from the NCEP NOAA NCEP Multigrid WaveWatch III Model Chawla et al. (2013).
For the period between 1979-2009 spectral boundary conditions were obtained from the NCEP WW3 Phase 2 waves hindcast . This 30 year wave climatology hindcast was performed using winds from the NCEP Climate Forecast System Reanalysis and Reforecast (CF10SRR) homogeneous dataset of hourly high-resolution winds.
For simulations beyond 2009 to present, spectral boundary conditions were obtained from NCEP’s wave model production hindcast, which uses wind input from NOAA’s operational Global Forecast System (GFS) weather model.
This spectral forcing has been previously shown to provide very good results for nearshore SWAN modeling in Puerto Rico and the US Virgin Islands (e.g. Anselmi et al., 2012; Canals and García, 2019).
surface boundary conditions
Surface wind forcing was provided to the model using output from the NCEP Climate Forecast System Reanalysis and Reforecast (CFSRR) dataset of hourly high-resolution winds at an approximate resolution of 38 km.
It should be noted that the wave model hindcasts described above use global scale weather models with spatial resolution on the order of 25 km. Such weather models describe with good accuracy the wind patterns at regional and basin scales, but do not accurately describe the small scale structure of intense tropical cyclones.
To take into account the effects of hurricanes and tropical storms into the hindcast, the 40-year period was partitioned into periods with and without named storm events in the vicinity of the model domain.
Periods with named storms were identified using the National Hurricane Center’s HURDAT2 best track hurricane database (http://www.aoml.noaa.gov/hrd/data_sub/re_anal.html). For these events and time periods, the wind forcing for the simulation was obtained using the Generalized Asymmetric Holland Vortex Model, constructed using the hurricane parameters from the HURDAT2 database. This wind model has been used extensively for hurricane storm surge and wave simulations. For Hurricanes Irma and María, HWRF model output produced by NOAA/NHC/NCEP was used as surface boundary conditions.
The model was run from January 1, 1979 to December 31, 2018 and separated into month-long runs in hot-start mode. After each month-long simulation, the next simulation is restarted using a 2D spectral hot-start file produced at the end of the previous simulation. The figure below shows an example of the output from the hybrid SWAN simulations, in this case for March 6, 2018 (Winter Storm Riley). Colors represent significant wave height in feet and the arrows represent wave direction (wave direction shown for coarse structured grid only).
The model has been validated with all available CARICOOS buoy data, see the validation section for more details.

CIRCULATION MODELING
The Finite Volume Community Ocean Model (FVCOM) developed by Chen et al. (2011) has been implemented in Puerto Rico by the PI's research group (Adail Rivera and Haibo Xu) and its development has been funded primarily by CARICOOS and the Caribbean Fisheries Management Council. FVCOM employs staggered prismatic cells formed by the triangular elements in the horizontal and structured layers in the vertical to provide an accurate geometric representation of complex coastlines. The spatial resolution varies from 80 to 3000 meters, with the grid becoming more refined towards the coast. FVCOM solves the governing equations on Cartesian or spherical coordinates in integral form by computing fluxes between non-overlapping horizontal triangular control volumes (Chen et al, 2011). This finite-volume approach combines the best features of the finite-element methods for geometric flexibility and finite-difference methods for code simplicity and numerical efficiency. For this project we have used the CARICOOS FVCOM implementation to simulate ocean currents for calendar year 2019. The operational model on which the model used here is based can be viewed at https://www.caricoos.org/currents/forecast/FVCOM/PRVI/Currents. A screenshot of model results is shown below:

This high-resolution tool makes it possible to resolve multi-scale dynamics that the current operational regional systems cannot easily capture and understand hydrodynamic processes in the region of interest. In this chapter we provide a brief description of the model setup and validation, however, further details on the model may be found in Xu et al. (2022).
Initialization
The model is initialized using 3D model data from a regional version of the Navy Coastal Ocean Model (NCOM) for the American Seas (AmSeas) which assimilates quality-controlled observations including satellite sea surface temperature and altimetry, as well as surface and profile temperature and salinity data using the NRL-developed Navy Coupled Ocean Data Assimilation (NCODA) system (Cummings, 2006). The model is run in monthly periods, from December 1 2018 to December 31 2019. The model is spun up from rest for 30 model days (December 2018) to reach quasi-steady conditions. The following month-long simulations for calendar year 2019 use the most recent restart file generated from the previous month as initial conditions.
Open boundary conditions
Lateral boundary conditions steering the PRVI-FVCOM hindcast model are obtained from the AmSeas system, which provides the sub-tidal elevation, temperature, and salinity at 3-hour intervals. Data from this structured grid is bi-linearly interpolated horizontally to the PRVI-FVCOM grid and vertically to the sigma coordinate system. Fourteen harmonic constituents (M2, N2, S2, O1, K1, NU2, J1, P1, Q1, M4, MF, MM, SA, SSA) are included in the PRVI-FVCOM simulation. The amplitude and phases of those tidal constituents are predicted by the T-tide Matlab package with harmonic constants specified by TPXO-7.2 dataset (Egbert and Erofeeva, 2002). These tide-induced elevations are added to the sub-tidal components and imposed along the open boundaries.
Surface forcing
The spatially varying meteorological conditions for the FVCOM model are derived from the CARICOOS Weather Research and Forecasting (WRF) 2km and 6km resolution operational models (https://www.caricoos.org/winds/forecast/wrf2km/PRVI/wspd). Hourly variables at the ocean-air interface are used to drive and constrain the exchange of momentum, heat, and upper layer circulation. The wind stress is computed with the bulk formula of Large and Pond (1981) and surface net heat fluxes are calculated using the bulk parameterization scheme (Fairall et al., 2003).
Data assimilation
Several data assimilation modules are available for FVCOM to improve hindcast skills. This present work utilizes a practical nudging technique to merge observations to model-predicted values based on a weight function based on the bias from observed values. Daily sea surface temperatures are assimilated from the Operational SST and Sea Ice Analysis (OSTIA) system combining various sources of satellite observations (Donlon et al., 2012). Similarly, sea surface height assimilation is conducted on a daily basis with a dataset produced by Data Unification and Altimeter Combination System (DUACS) (Donlon et al., 2012). In order to constrain the model solutions and improve the forecast/hindcast capability, we assimilate High-Frequency Radar (HRF) measurements obtained by CARICOOS. Further details on the assimilation scheme may be found in Xu et al. (2022).


