WAVE MODEL VALIDATION
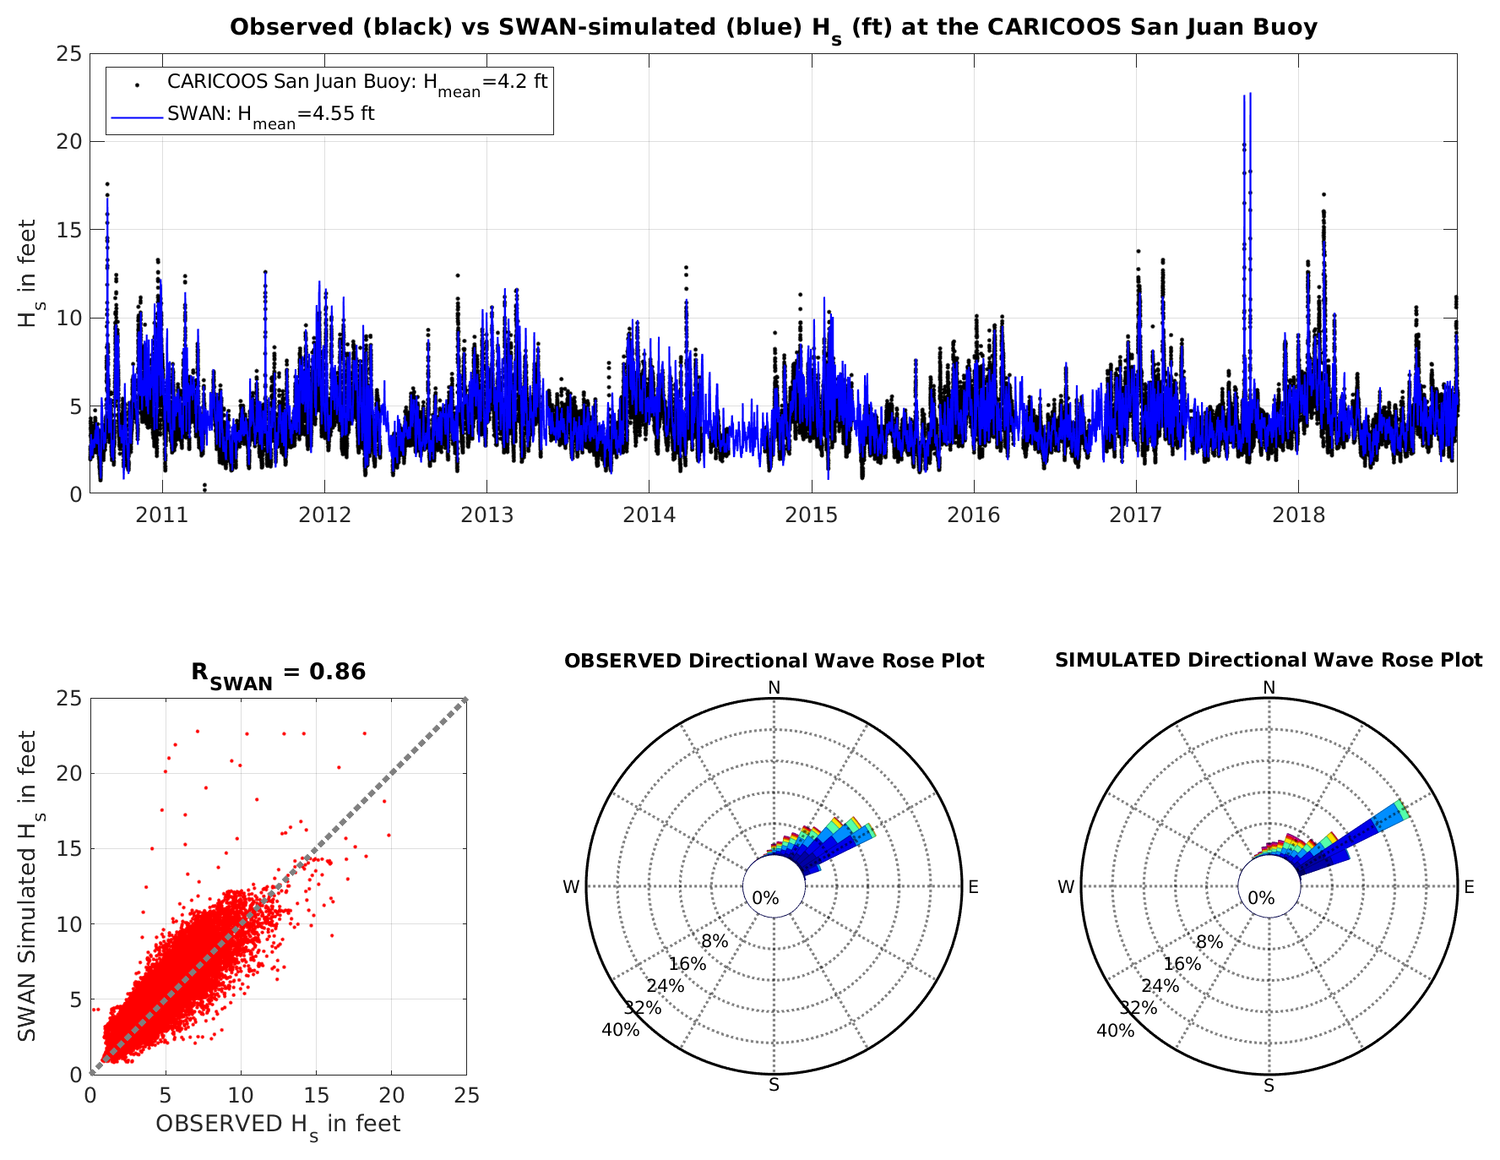
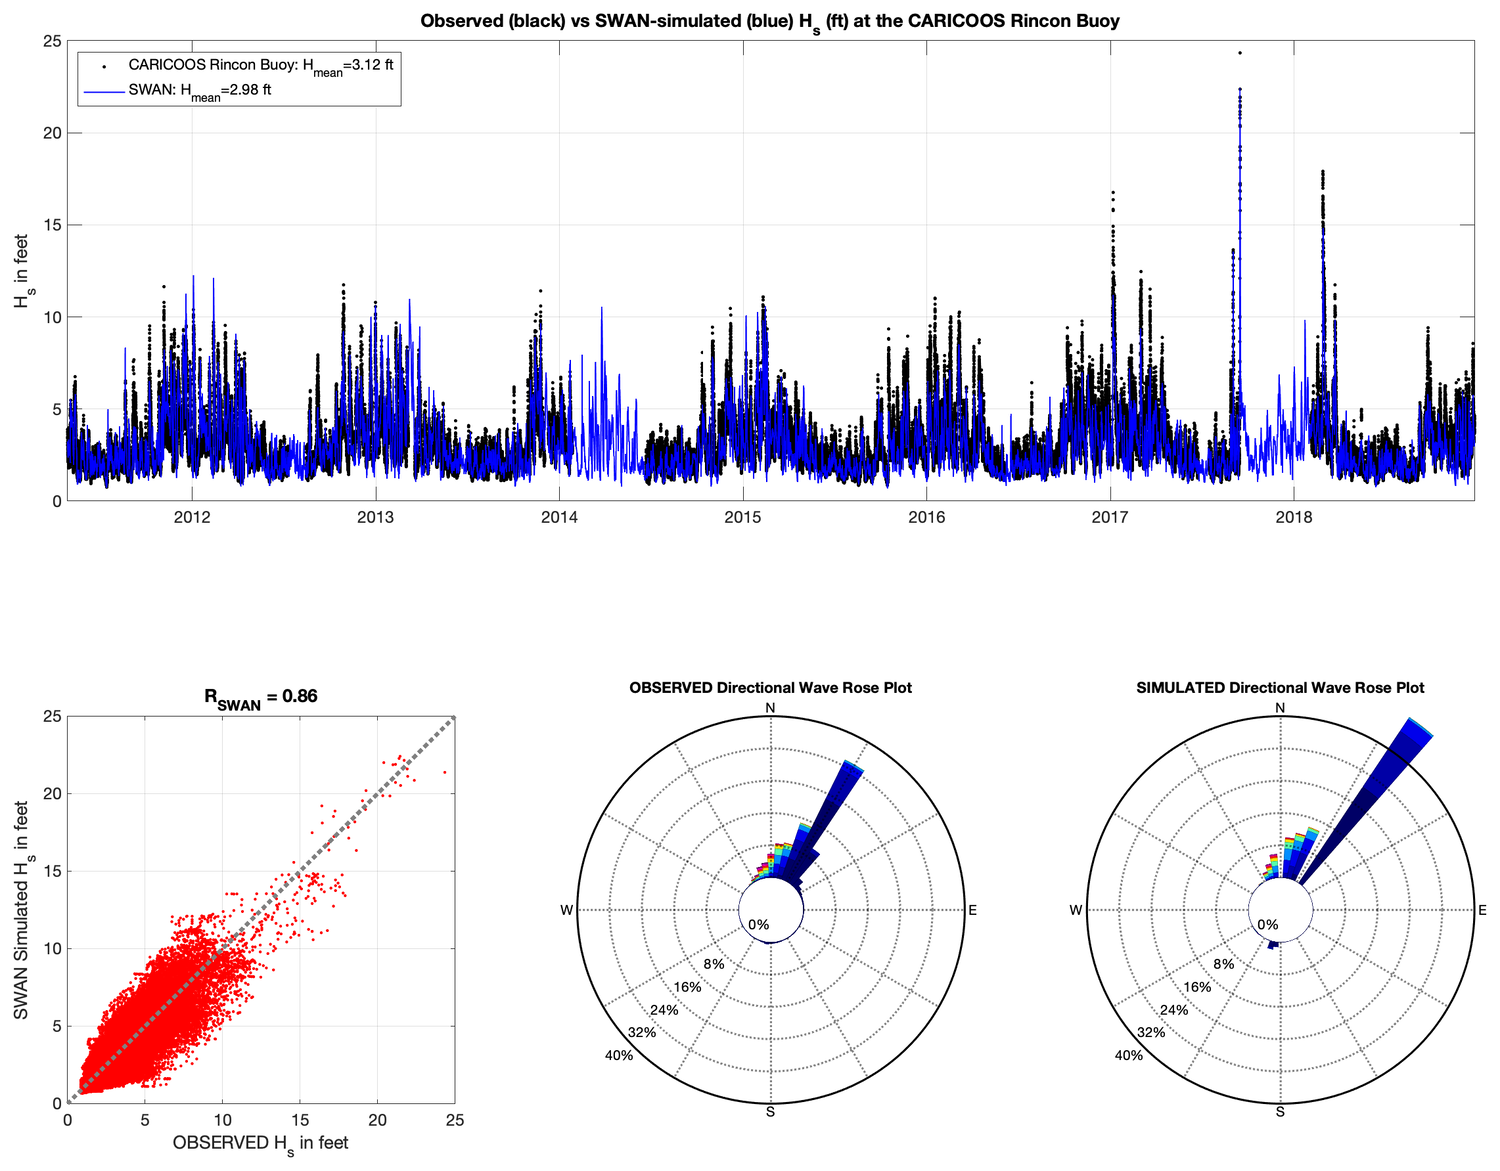
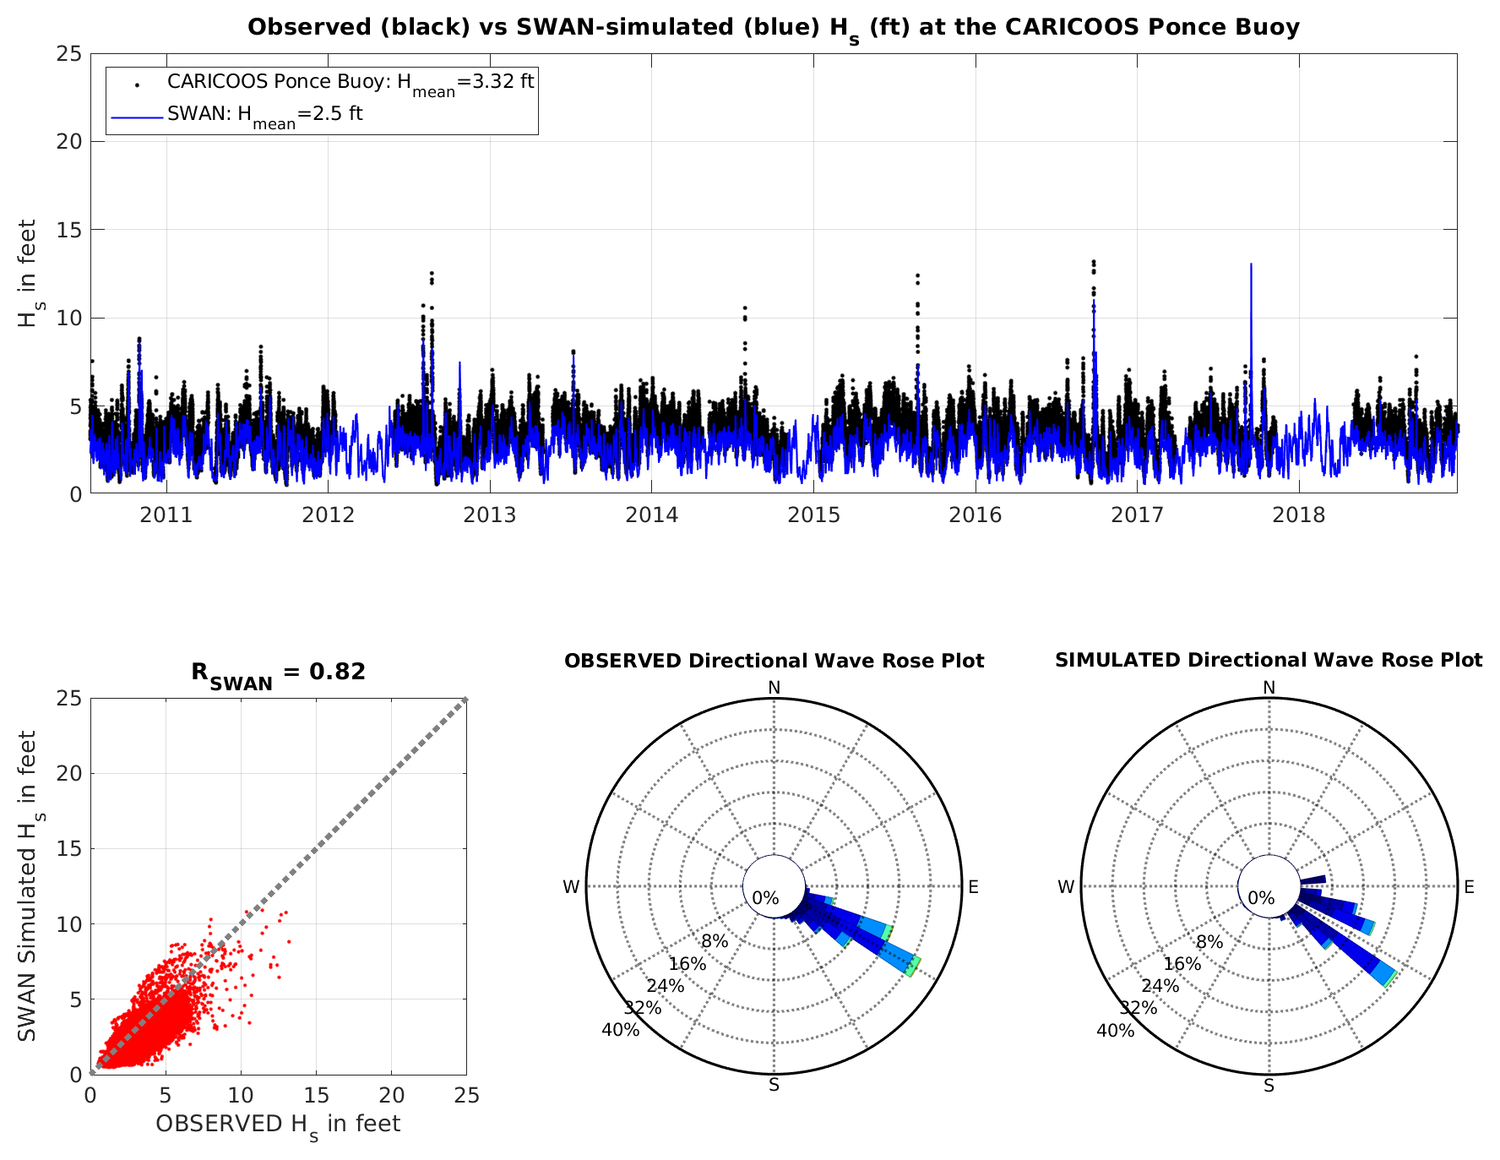
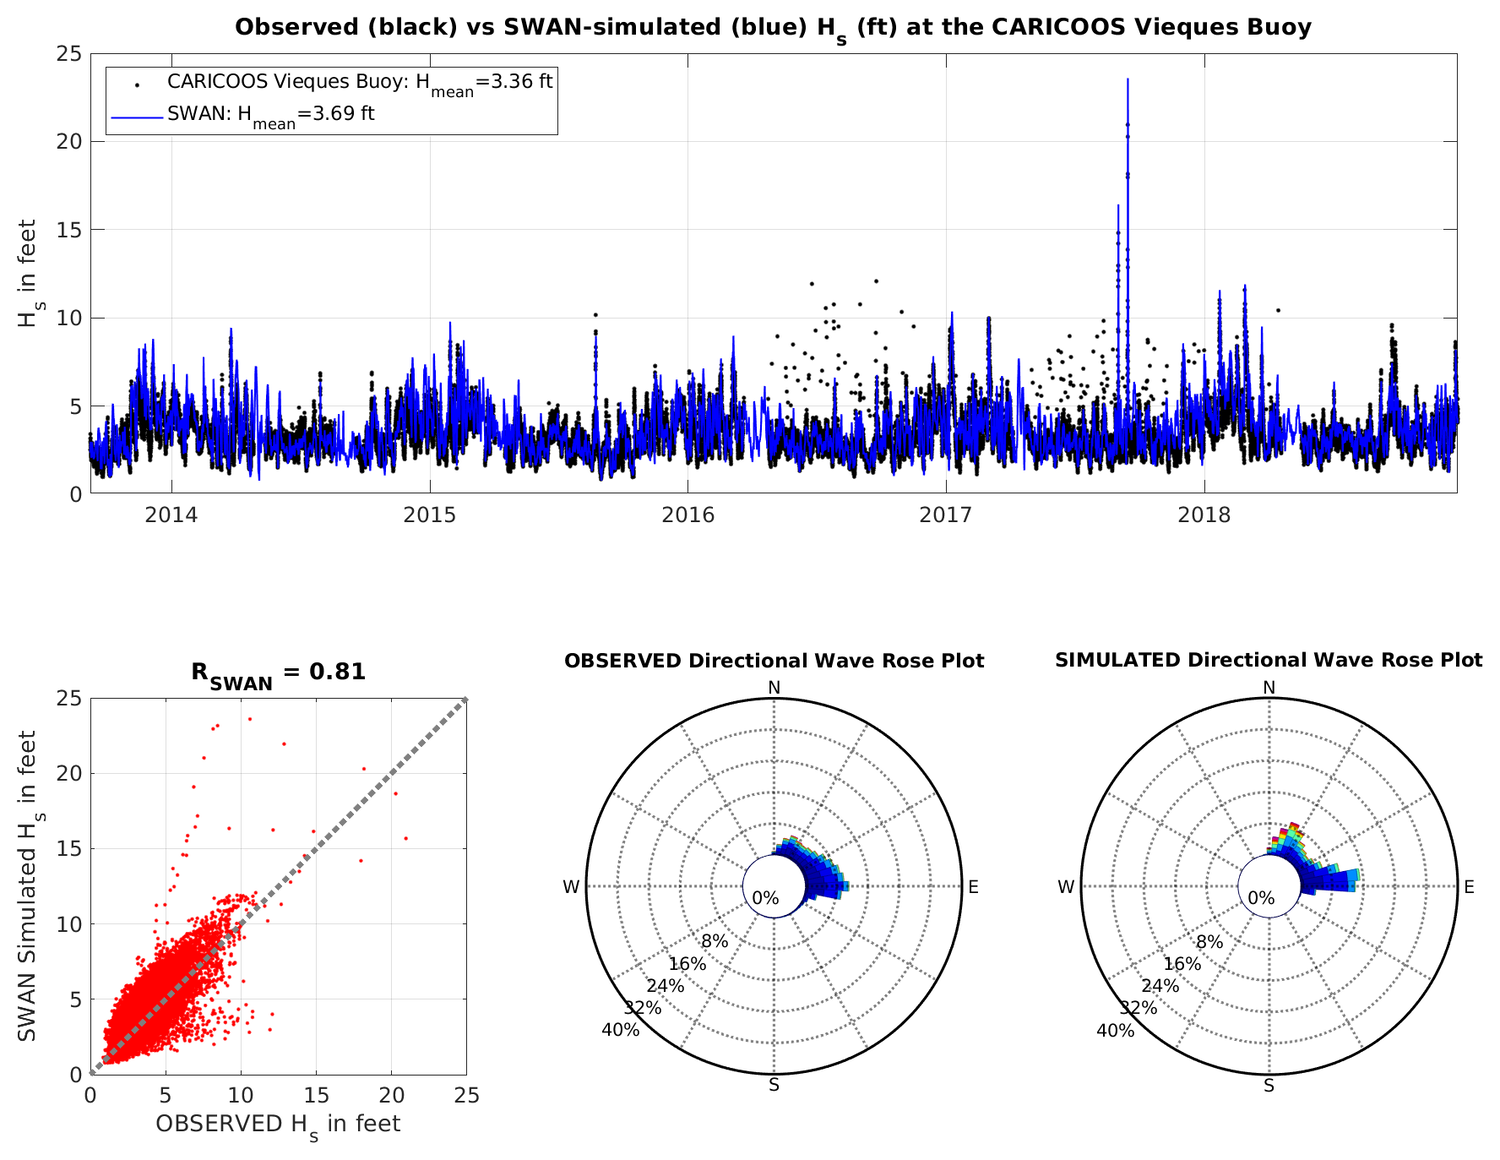
To ensure the high fidelity of the wave simulations, the model has been validated rigorously historical observations obtained from buoys operated by the Caribbean Coastal Ocean Observing System. All buoy data from the San Juan, Rincon, Vieques and Ponce buoys during the CARICOOS era (2009 to present) has been used to quantify model performance, and the results are shown below. Model - data comparison against the St. John CARICOOS buoy will be completed as part of a second phase of the study sponsored by CARICOOS which will expand some components of the wave climate atlas to the US Virgin Islands.
FVCOM CIRCULATION MODEL VALIDATION
WATER LEVEL VALIDATION
Water level validation was carried out at eleven tide gauges operated by NOAA and located across the coastal areas of PR/USVI. A 30-day time series of the observed (black line) and FVCOM-modeled (blue line) water levels for January 2019 is illustrated in the figure below, as well as AmSeas simulated water levels (red line):
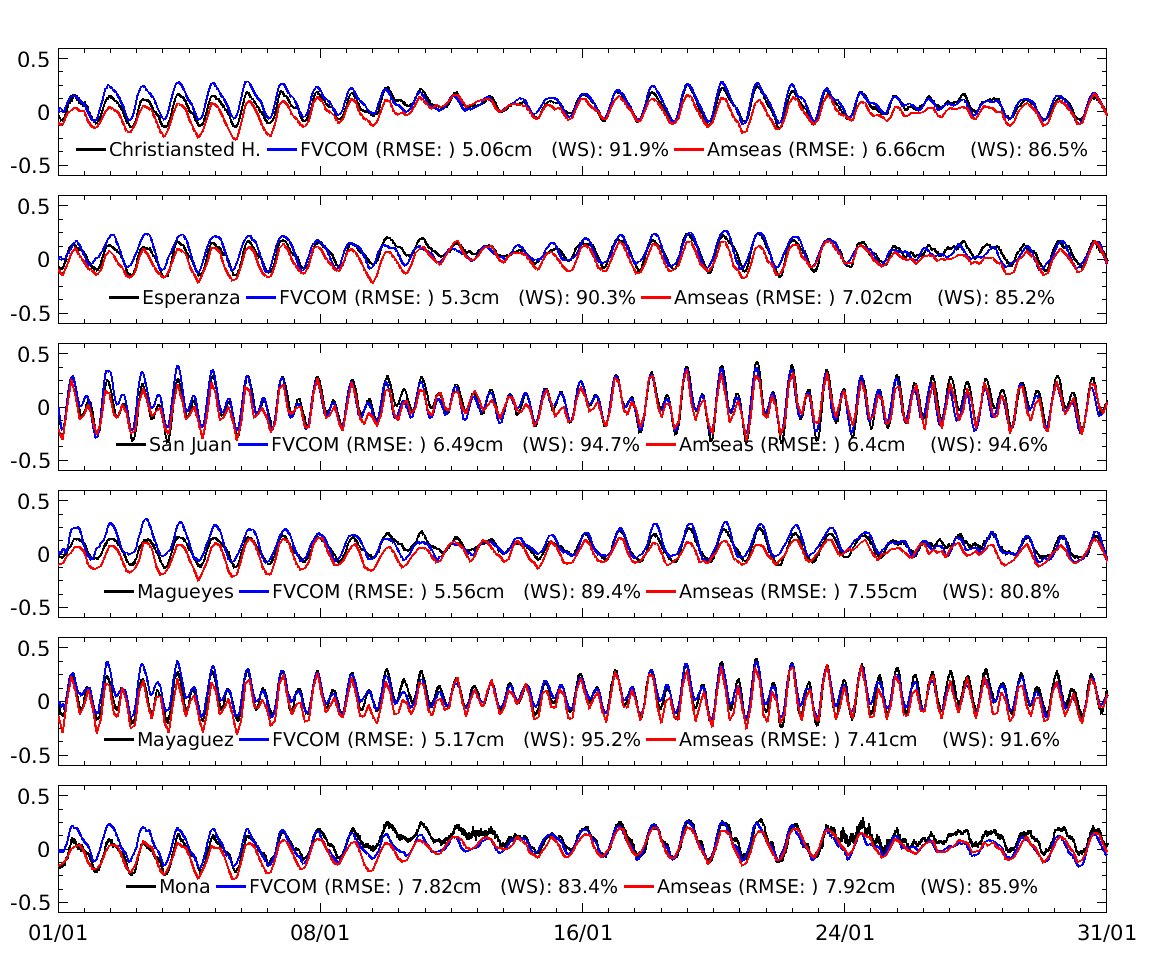
The computed statistics for PRVI-FVCOM show a Willmott Skill (WS) of about 90\%, and a root mean squared error (RMSE) lower than 6.5 cm with the only exception of Charlotte Amalie, where the WS is 76\% and RMSE is 10 cm. Water levels simulated by AmSeas have an approximate model skill of 87\% and an average RMSE of 7.03 cm, indicating PRVI-FVCOM makes better predictions for surface elevation with a reduction of overall RMSE and an increase of average model skill.
SURFACE CURRENT VELOCITIES
Two acoustic current profilers were deployed in January 2019 as part of a project funded by the Caribbean Fishery Management Council. One was deployed east of the island of Vieques (El Seco) and another at Hind Bank south of the island of St. Thomas. Data from these ADCP deployments is very useful for validating our FVCOM model since it includes full water column water velocity data. Details on the ADCP deployments may be found in Xu et al. (2022). The figure below shows a time series of observed (black line) and simulated (red: AMSEAS, blue: FVCOM) ocean current profiles for the ADCP deployed at Hind Bank:
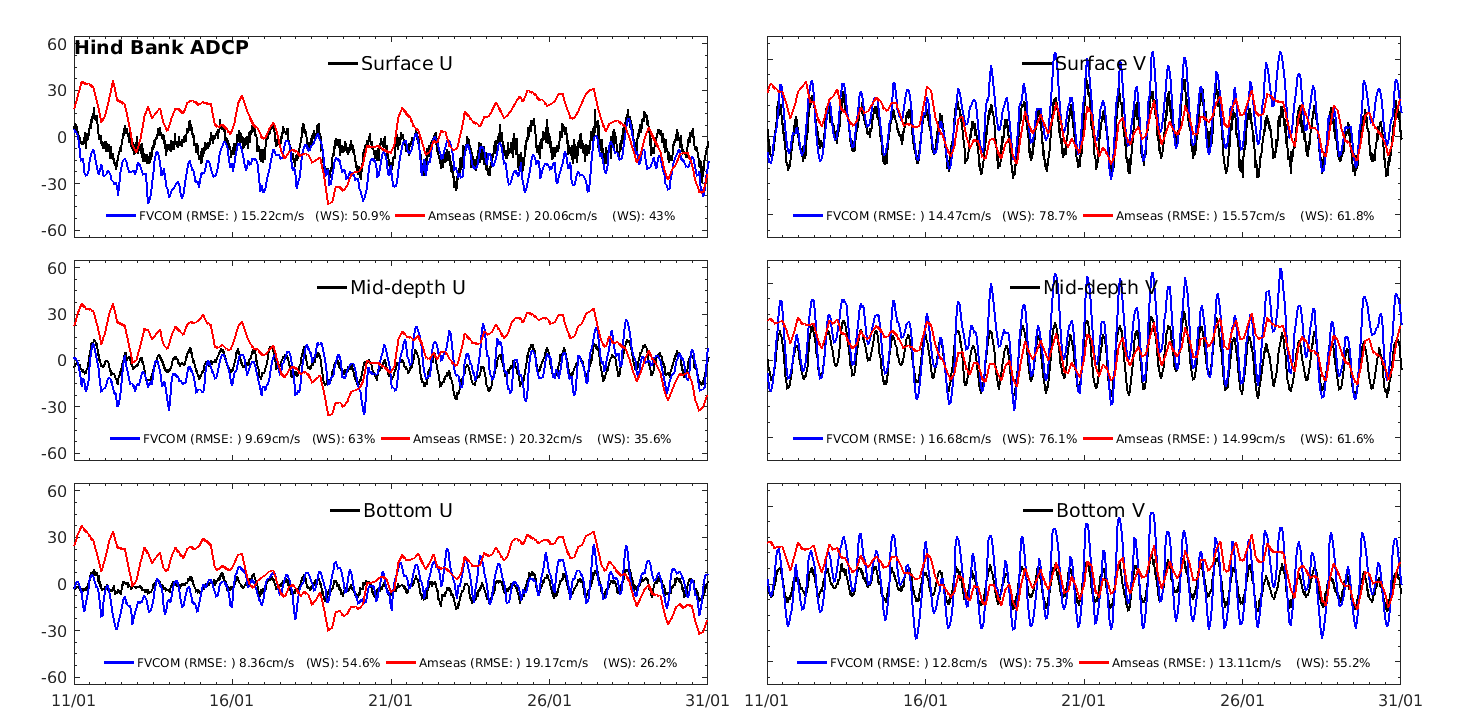
At this location, PRVI-FVCOM shows significant improvement in the northward component over AmSeas as shown by the WS of 78.7% and 61.8% for each model, respectively. Note that this is only a example of FVCOM model performance. The resder is referred to the paper by Xu et al. (2022) for further model validation as well as a comparison between FVCOM model data and CARICOOS buoy surface current velocity measurements.


